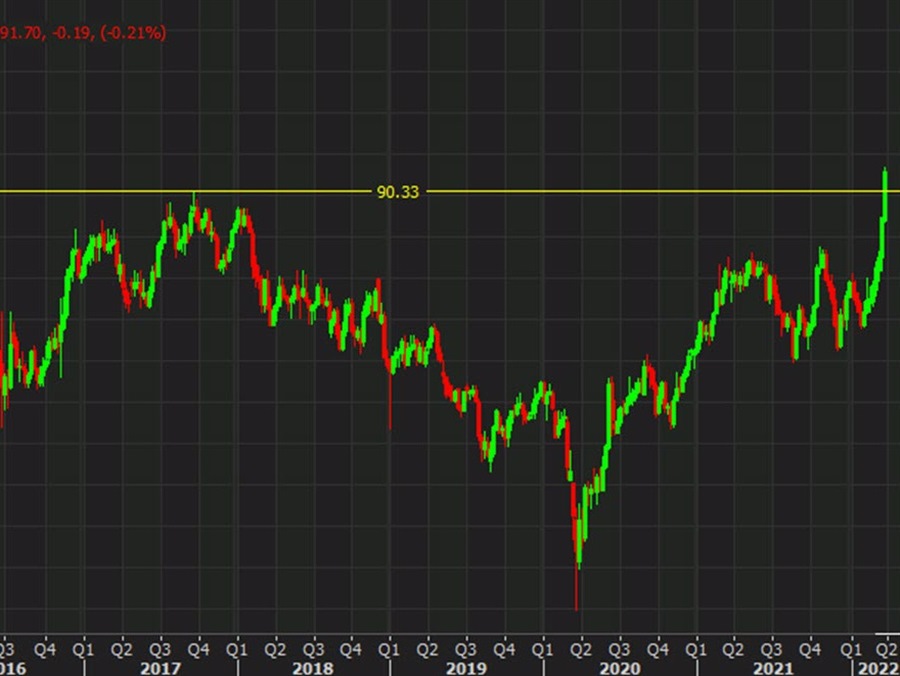
AUD/JPY is modestly lower today in what would be the first daily decline after eight straight days of gains but it’s the weekly chart where I want to focus. It’s gone parabolic, adding 4% this week in the eighth consecutive week of gains.
The rally this week blew through the 2017 high and is one of the best weeks for the pair in a decade. That’s added up to the sixth largest monthly gain since 2010.
The weekly chart shows the power of this breakout after 16 months in the 78-86 range. If you take that as a consolidation and break, the measured target would be around 94.00.

What worries me is that the gains in this pair are escalating, which is a sign of a disorderly market. We’re also approaching fiscal year end in Japan. Anytime there’s an 8-week and 8-day winning streak, you have to be cautious but this time especially so.
