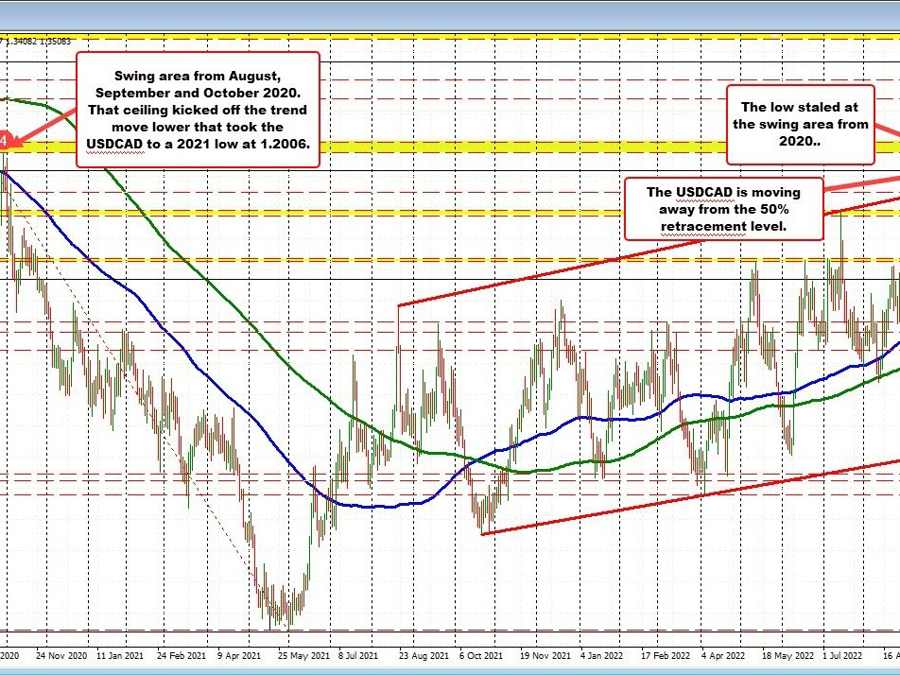
USDCAD corrects to an old swing area
The USDCAD has been on a run to the upside with the pair up 6 of the last 8 trading days (with modest declines on the 2 down days). The price has moved from a low on September 13 at 1.2953. The high price today reached 1.3543 for a gain of 590 pips over 8 trading days. On Tuesday of this week, the price move and closed above its 50% midpoint of the range since the 2020 high (see daily chart above). That level came in at 1.33364. Moving above that level tilted the longer term bias more to the upside. The price also extended above a topside trend line earlier in the week. Bullish.
Yesterday the pair moved above a swing area between 1.3389 and 1.34194 going back to swing highs in August, September and October 2020. Another bullish target taken out.
Looking at the daily chart, the price moved up to a high price of 1.35430 before rotating back to the downside and erasing the gains on the day. However when the price reentered the aforementioned swing area between 1.3389 and 1.34194, dip buyers entered and have since pushed the price back to the upside. The current price trades around the 1.3500 level.
Going forward it would take a move below the 1.3389 level to give the sellers more comfort now that that support level has held on the dip (the levels importance increases). The 50% midpoint at 1.33364 is another key level that would need to be broken – and stay broken – for sellers to take back more control from what is a bull trend run.
Drilling to the hourly chart below, the corrective move to the downside today saw the price retest an upward sloping trendline and the correction zone between the 38.2% -50% retracement of the last trend move higher between 1.3385 and 1.34225).That area dovetails (roughly) the support off the weekly chart between and 1.3389 and 1.34194 which once again increases the areas importance..
The rising 100 hour moving average is still a distance away at 1.33475., Getting below that moving average would add to bias tilt back to the downside. Until then, the buyers/ remain in the driver seat from the medium-term/longer term prospective.
Note that on Tuesday, the price found support against that 100 and hour moving average before starting the next trend leg to the upside from 1.32262 the high price today of 1.35437 (317 pips in the 3 trading days – see hourly chart below). That too is an indication of the bullishness in the market.
USDCAD retraces to support and bounces
