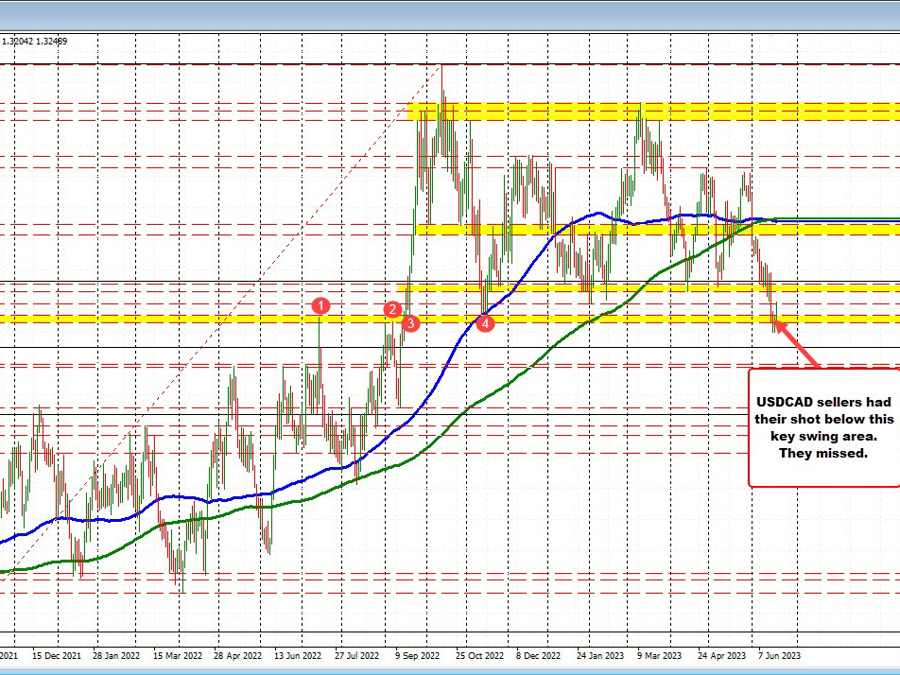
The USDCAD last week fell below a key swing area on the daily chart (see chart below). That area came between 1.3207 and 1.32299. However, momentum could not be sustained, and in trading today the price has moved higher and above the high of the swing area.
USDCAD on the daily chart
Drilling down to the hourly chart below, the price has also moved above the falling 100-hour moving average at 1.32422. That level will now be close support. Over the last 7 or so trading days, the price has moved above that 100-hour moving average on a number of occasions but stalled well ahead of the falling 200-hour moving average. That 200-hour moving average currently comes in at 1.32913 and represents the next key target. If the buyers are to take control, getting and staying above the moving average is essential. The price of the USDCAD has not traded above the 200-hour moving average since June 1.
Support now at the 100-hour MA at 1.3242 and the high of the swing area at 1.32299. On the topside, the low from last Wednesday at 1.32871 and the falling 200-hour MA at 1.32913 are upside targets that need to be broke, if the buyers are to take more control.
USDCAD on the hourly chart
