Both the NASDAQ index and the Dow industrial average are both up back above their 200 week moving averages.
- The NASDAQ index 200 week moving averages near 11131 today. The current prices trading at 11151.
- The Dow industrial average 200 week moving averages at 29797.06. The current prices trading at 30194.
Both the Dow industrial average and the NASDAQ index have closed below and there 200 week moving average for 2 weeks in a row. It is still early in the week, but if the indices can close above their 200 week moving averages, it would tilt the longer term bias back to the upside at least for the short term.
Looking at the hourly chart of the NASDAQ index, it is also back above its falling 100 hour moving average at 11130.36 (also that is also where the 200 week moving average is located).
Needless to say the level is an important level from a technical perspective (both the hourly and the weekly charts have key technical levels near that level)..
NASDAQ index is above its 100 hour moving average
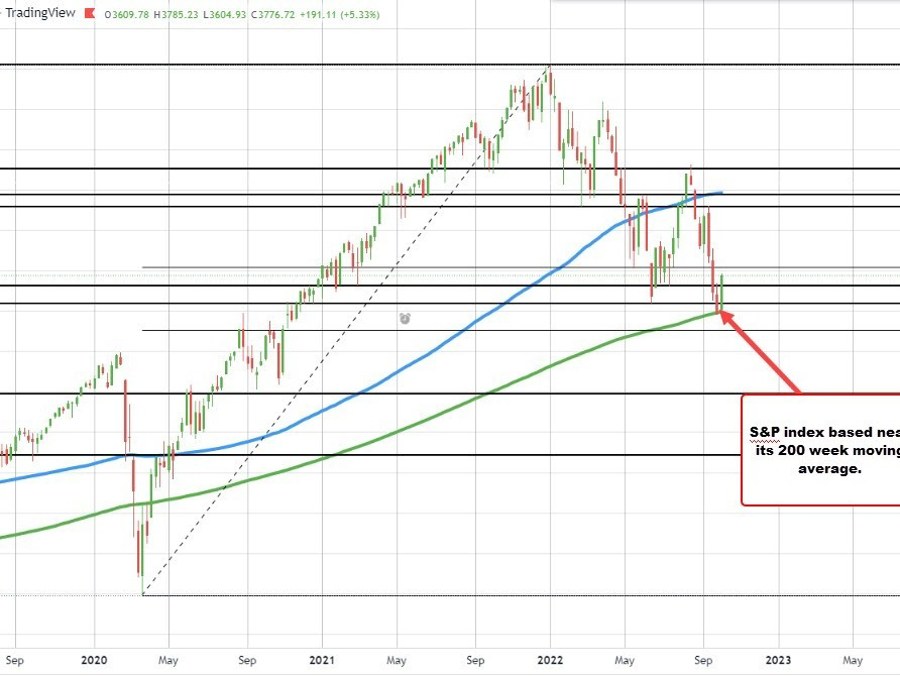
For the S&P index, it closed just a few points below its 200 week moving average last week. This week the price based just above the 200 week moving average yesterday at 3595.06 (the low for the week was at 3604.93). The price is currently trading at 3776.77 and moving back away from that key moving average level.
S&P index based near its 200 week moving average
Buyers are trying to take back more control.