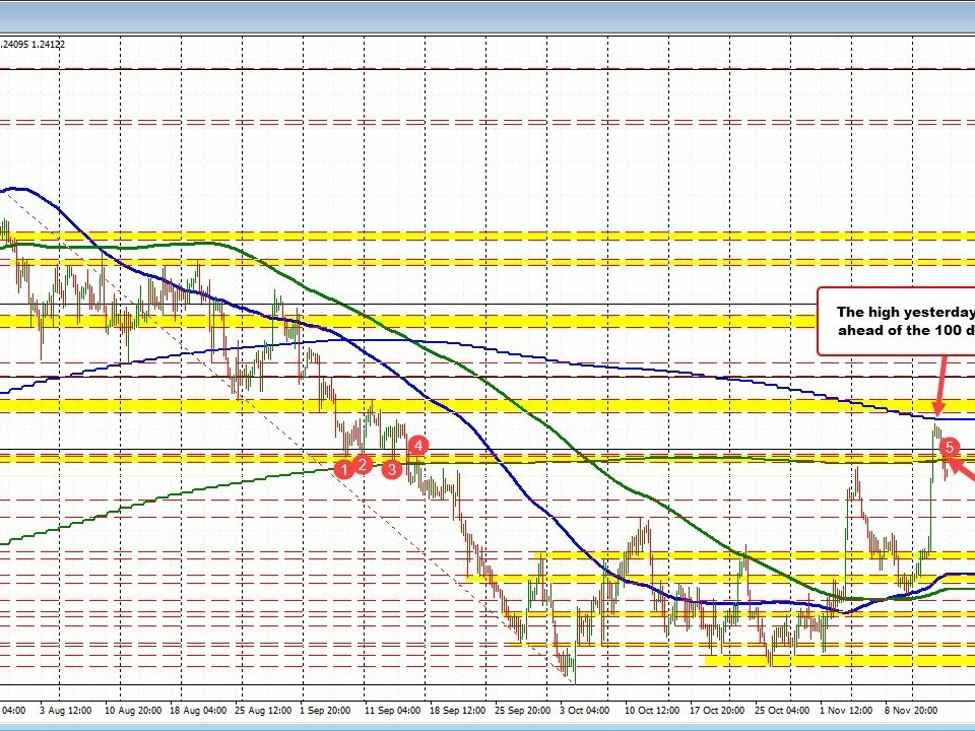
The GBPUSD is back below its 200 day moving average
The GBPUSD ran higher yesterday, and in the process extended toward its 100-day moving average near 1.2512. The high price got within 7 pips of that level at 1.2505 before rotating back to the downside.
In trading today, lower-than-expected CPI data out of the UK sent the price lower and that was helped by increased buying in the US dollar today. US yields have moved higher helping the move to the upside in the greenback (lower GBPUSD).
Technically, the price fell back below the broken 38.2% retracement of the move down from the July high at 1.24582. The price then fell below a swing area between 1.2433 and 1.2449. Finally, the price also moved below its 200-day moving average at 1.2439.The pair is currently trading at 1.2409.
What next?
Going forward, the 200-day moving average will be a barometer for buyers and sellers. Staying below is more bearish. Moving back above it and then the 38.2% retracement 1.2458 would increase the bullish bias and give the buyers more hope for another run toward the 100-day moving average.
The last time the price closed above the 100 day moving average was back on September 1 when the moving average was up at 1.2649.
