Takes out the low from yesterday’s trading
The GBPUSD has been steadily moving lower over the the course of the NY session and has just moved below the low target from yesterday’s trading below 1.38022 and also below the natural support at 1.38000. The low 1.37935 so far.
Looking at the hourly chart, the pair is testing/dipping below a swing area between 1.37965 1.3802. The next key target would come in at the 50% retracement of the move up from the July 20 low. That level comes in at 1.37769.
Helping the downside in the EURGBP today is a run up in the EURGBP.
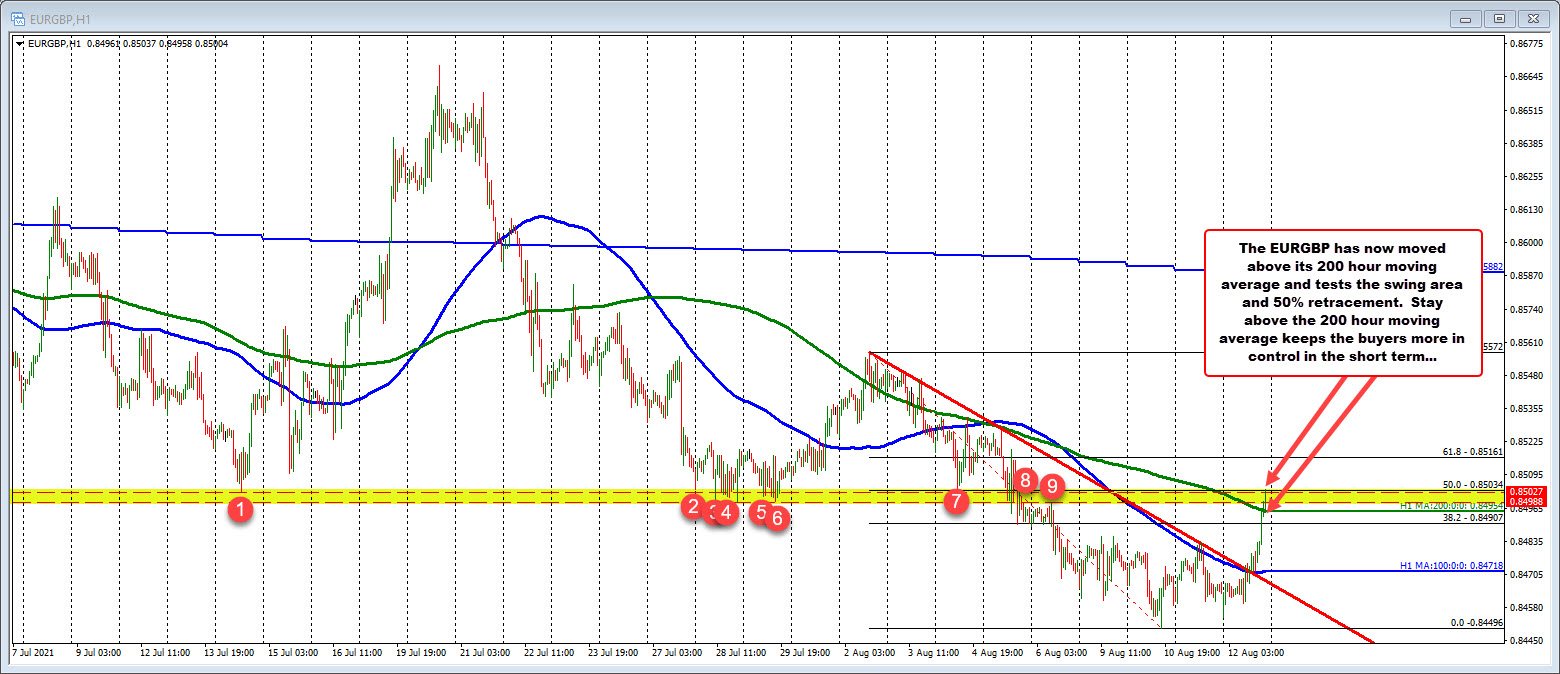
Looking at the hourly chart of that pair, the price moved above a downward sloping trendline and 100 hour moving average near 0.84718, and has now trended up through the 200 hour moving average at 0.8495. The price is now testing a swing area between 0.84988 and 0.85027 (see yellow area and red numbered circles in the chart below). Also near the area is the 50% retracement of the move down from the August high to the August low at 0.85034. Move above that cluster of resistance and it should open up the door for further upside momentum.
When the EURGBP moves higher, that of course represents a stronger EUR and weaker GBP. The buying, therefore, helps to weaken the GBPUSD in the process.