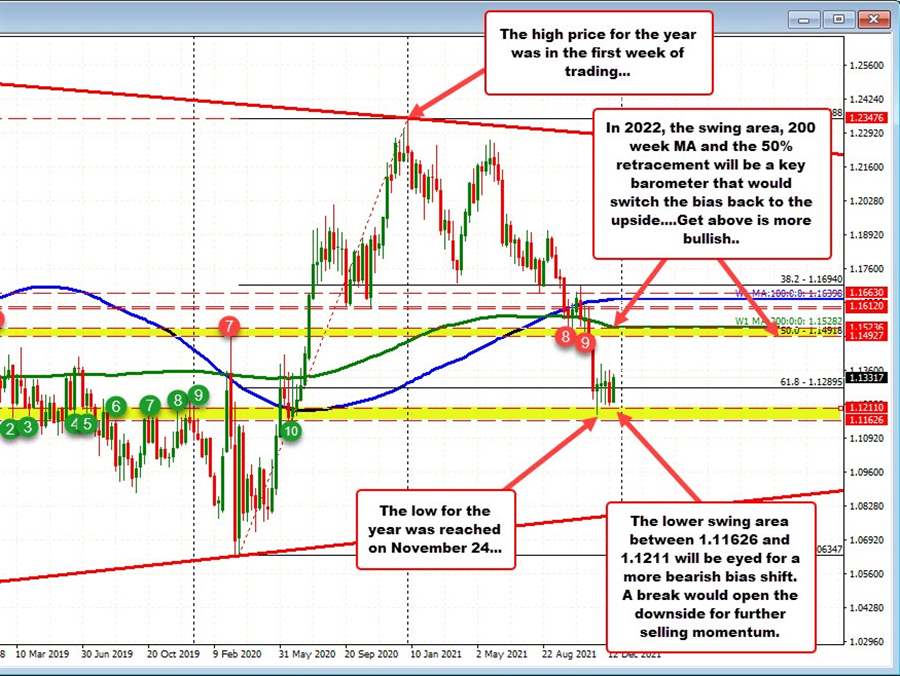
The EURUSD has seen the price move down in 2021. In fact the high for the week was reached in the first week of the year (on January 6) at 1.23488. The low for the week was reached toward the end of November at 1.11853 (on November 24).
The high low range was around 1163 pips which was better than the 687 pip range through the first nine months of 2021. A total of about 481 pips was added since September 29.
Since bottoming on November 24 at 1.11837, the high price has extended to 1.13823 (or about 199 pips). The range for December has been more narrow at about 138 pips with a high price of 1.13592 and a low price of 1.12208 with lots of ups and downs.
Technically, looking at the weekly chart the move back to the downside in 2021 has seen the price move back below the 100 week moving average (blue line) currently at 1.16398, and the 200 week moving average (green line) currently at 1.15282.
The price also moved below the 50% midpoint of the range since the 2020 low (around the start of Covid) at 1.14918. Finally a swing area between 1.14918 and 1.15236 (see red numbered circles) was also broken.
After breaking through those levels and reaching the November 24 low, the price has been waffling above and below the 61.8% retracement 1.12895 as traders ponder the next move.
Overall, if I were to put a bias on the pair as we head into the end of the year, it would be more bearish as the price is below:
- The 50% retracement
- The 200 week moving average
- The swing area between 1.14927 and 1.15236.
- The 100 week moving average at 1.16398
Having said that the low for the year did stall near a swing area going back to 2018 between 1.1162 and 1.1211.
So although the price is near the low for the year, and below key longer term moving averages, there has been dip buyers against support that has a slowed the decline, and given traders cause for pause. Traders are leaning.
Drilling to the hourly chart below, the consolidation has converge the 100 and 200 hour moving averages near 1.1288. Those moving averages will be the defining technicals for the short/intermediate term bias.
In trading today, the price low stalled right against those levels and has seen a move to the upside. However, the price would need to get outside of the red box which has confined the pair mostly since mid-November. The high of that red box comes in at 1.1359.
As a result there is a bias in the direction of the buyers in the short/intermediate term. Move below the moving averages in the new year and that bias shifts back to the downside (bears).

SUMMARY: The view of the EURUSD on the weekly chart is in the favor of the sellers, but with support slowing the fall.
Meanwhile the shorter/intermediate term bias is favoring the buyers off the bounce on the 100/200 hour moving averages. However, like on the weekly chart, there is work to do to increase the confidence in that bias.
