Fundamental
Overview
Copper remains under pressure, albeit the bearish momentum appears to be
slowing. Last week, the FT reported that stockpiles in Shanghai warehouses hit
their highest level since 2020 amid weak demand due to China’s real estate
sector downturn. Given the high prices reached in the previous month,
manufacturers refrained from buying since they had an incentive to deplete
their inventories.
The FT also reported that Chinese copper fabricators appeared to have
resumed buying the metal, with stocks showing minor declines in recent weeks.
All else being equal, if we continue to see the pickup in global growth, we
could see new highs in the coming months, although more policy support from the
Chinese officials would give the market a stronger boost.
Copper
Technical Analysis – Daily Timeframe
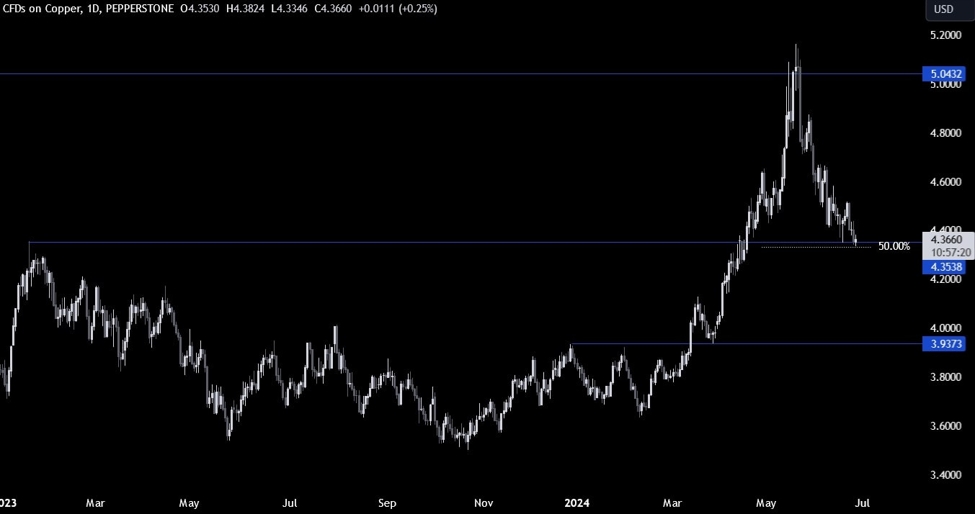
Copper Daily
On the daily chart, we can
see that after a minor bounce, copper fell back to the 4.35 support
where we can also find the 50% Fibonacci retracement level for confluence. This is where we can expect the
buyers to step in with a defined risk below the level to position for a rally
into a new all-time high. The sellers, on the other hand, will want to see the
price breaking lower to increase the bearish bets into the 4.00 level.
Copper Technical
Analysis – 4 hour Timeframe
Copper 4 hour
On the 4 hour chart, we can
see that the downside momentum seems to be slowing as the lower lows get shallower.
This might be a signal for a reversal although a break to the downside could
invalidate it.
If we do get a rally from these
levels, the first target for the buyers should be around the 4.66 level where
we can find the 38.2% Fibonacci retracement level of the entire correction. That’s
also where we can expect the sellers to step back in with a better risk to
reward setup to target a break below the 4.35 support.
Copper Technical
Analysis – 1 hour Timeframe
Copper 1 hour
On the 1 hour chart, we can
see that we have a minor downward trendline defining the current downward
momentum. The buyers will want to see the price breaking higher to gain more
conviction and increase the bullish bets into the 4.66 level. The red lines
define the average daily range for today.
Upcoming
Catalysts
Tomorrow we get the latest US Jobless Claims figures, while on Friday we
conclude the week with the US PCE.
