- Oil prices are bid ahead of the Fed on-demand expectations.
- The focus is back on tight supplies rather than rising coronavirus infections.
West Texas Intermediate (WTI) crude is higher on the day following data showed US crude inventories fell more sharply than analysts had forecast.
At the time of writing, WTI is trading at $72.48 and up over 0.8% after climbing from a low of $71.73 and reaching a high of $72.57.
The focus on Wednesday is on tight supplies rather than rising coronavirus infections.
Crude inventories fell by 4.1 million barrels in the week to July 23, the US Energy Information Administration said Wednesday. Gasoline and distillate fuel stocks also dropped.
The data follows the prior day’s American Petroleum Institute (API) which had little initial impact on the market:
- Crude -4.728M.
- Cushing -0.126M.
- Gasoline -6.226M.
- Distillate -1.882M.
Meanwhile, the spread of the delta variant, despite vaccination programs, had capped progress in rising prices, and while it remains a concern, the market is taking the view that demand will outstrip supply.
”While the delta-variant continues to spread in the US, it is unlikely to meaningfully tighten mobility restrictions and derail the recovery in energy demand,” analysts at TD Securities explained.
Equally, although the Organization of the Petroleum Exporting Countries and allies, known as OPEC+ have agreed to increase supply by 400,000 barrels per day from August, this is seen as too low.
”OPEC’s cautious output deal will continue to underwhelm the recovery in energy demand,” the analysts at TD Securities argued.
Meanwhile, the focus is on the statement from the US Federal Reserve policy meeting due at 1800 GMT and the Fed’s chair, Jerome Powell, shortly afterwards.
Oil prices could be affected by the outcome of the event from the impact on the US dollar, for which oil is predominately priced, US stocks, the Fed’s view on the economy, the delta variant and the possibility of a timetable for tapering.
WTI technical analysis
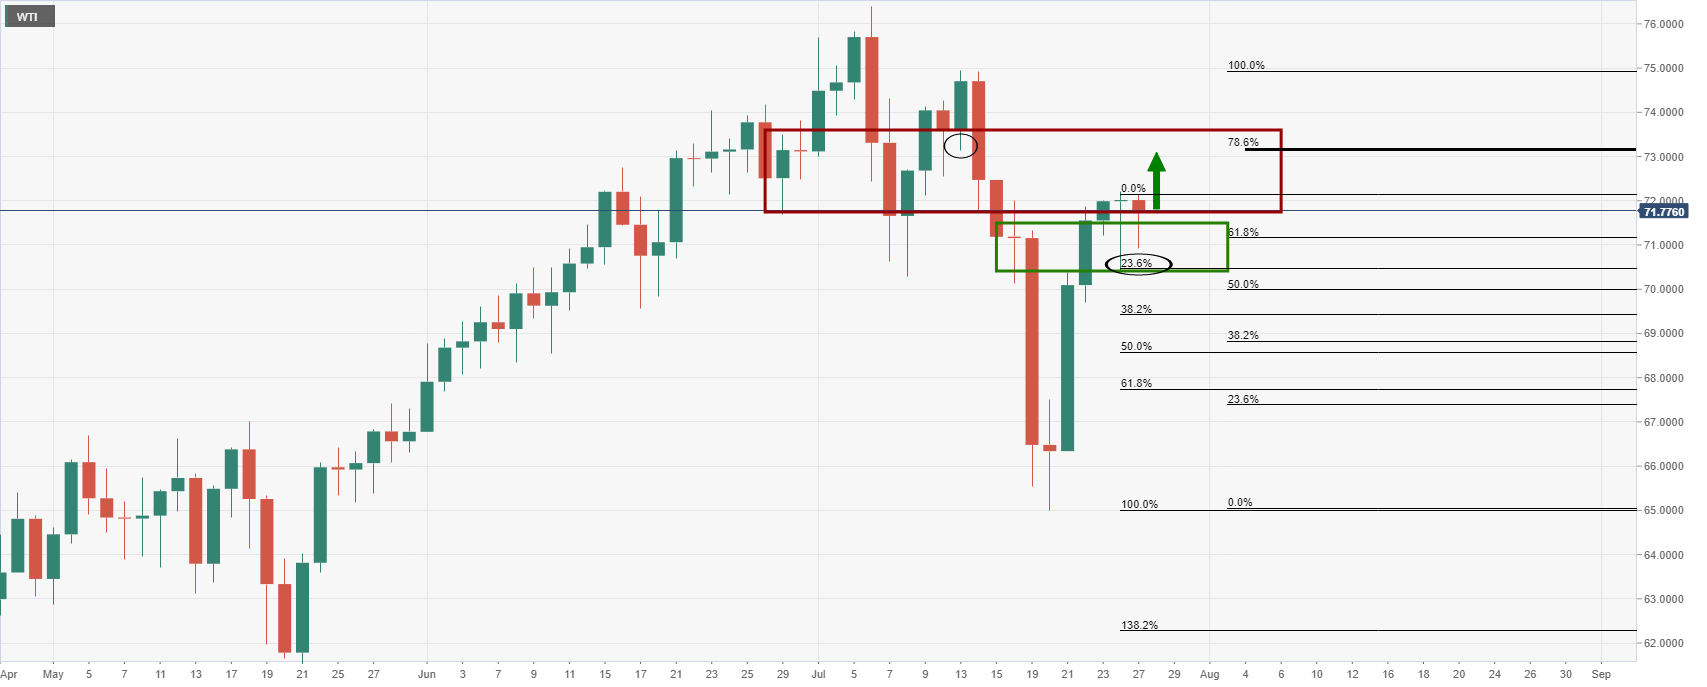
In yesterday’s chart analysis, above, it was noted that the price was supported by the 23.6% Fibonacci retracement of the current daily impulse near 70.50.
It was stated that the bulls can target the 78.6% Fibonacci retracement of the prior bearing impulse that has a confluence with the 13 July lows at 73.13.
Progress:
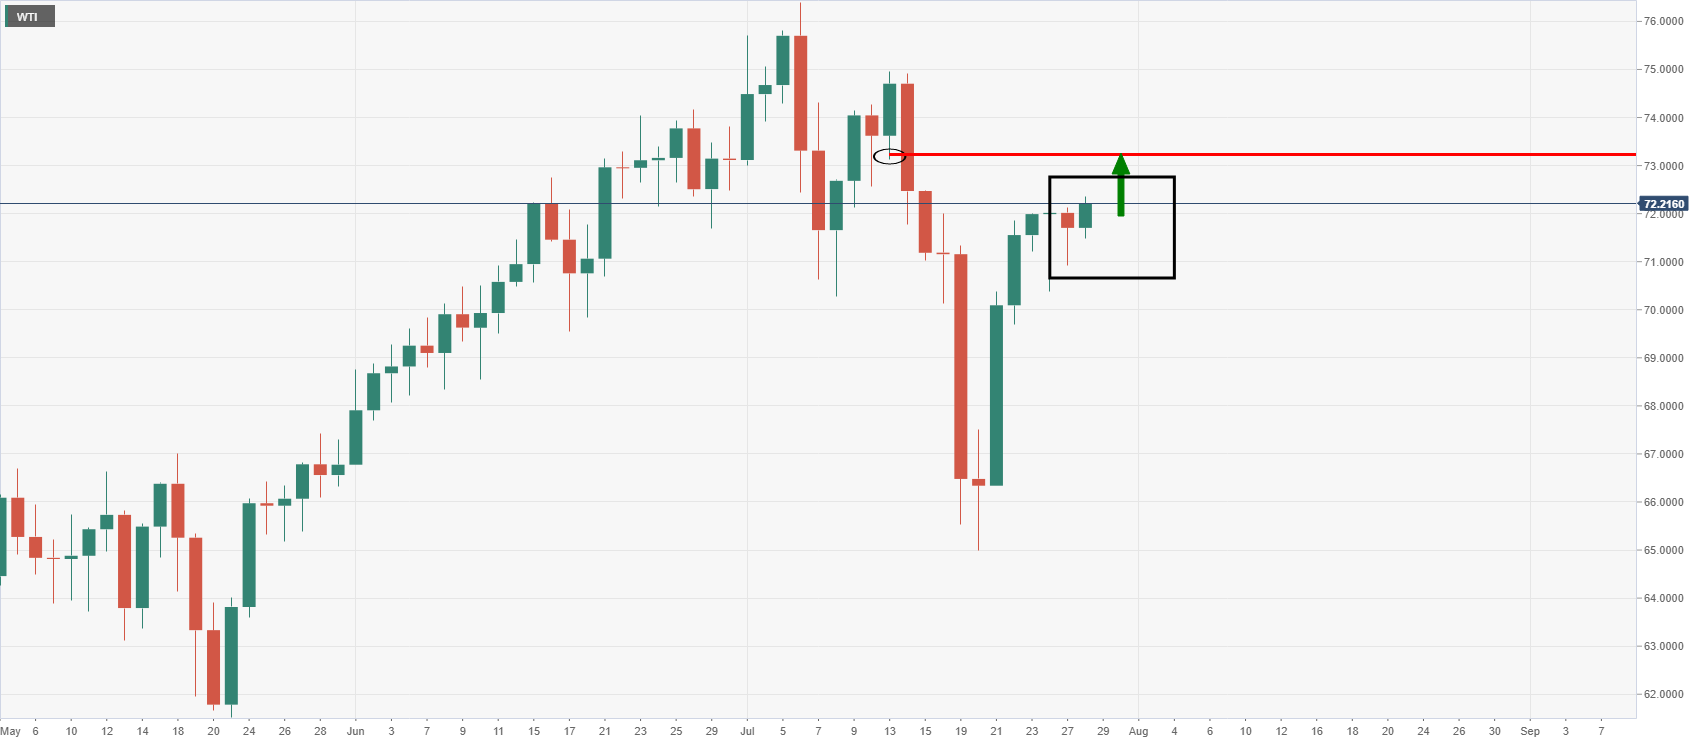
With all that being said, the Fed could throw a spanner in the works and send the US dollar flying high on an uber hawkish twist, such as mentioning a time frame for tapering within the statement itself.
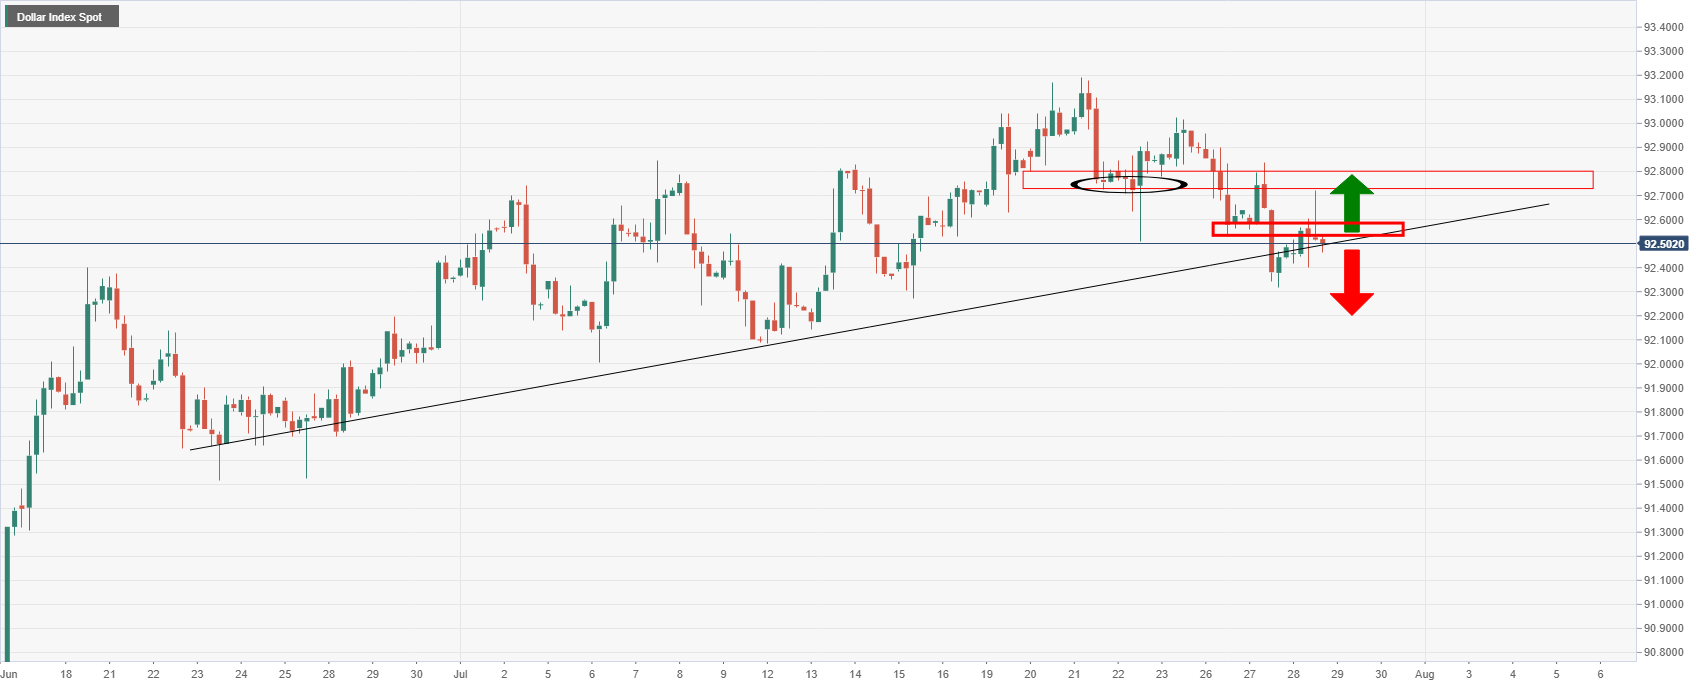
DXY daily chart
If the bulls go in for a harder test of the resistance near 92.80, then oil could come under pressure.
This could negatively impact risk appetite and result in a deeper correction to test the bullish commitments at the 38.2% Fibo near 69.50 and below the psychological 70 level.
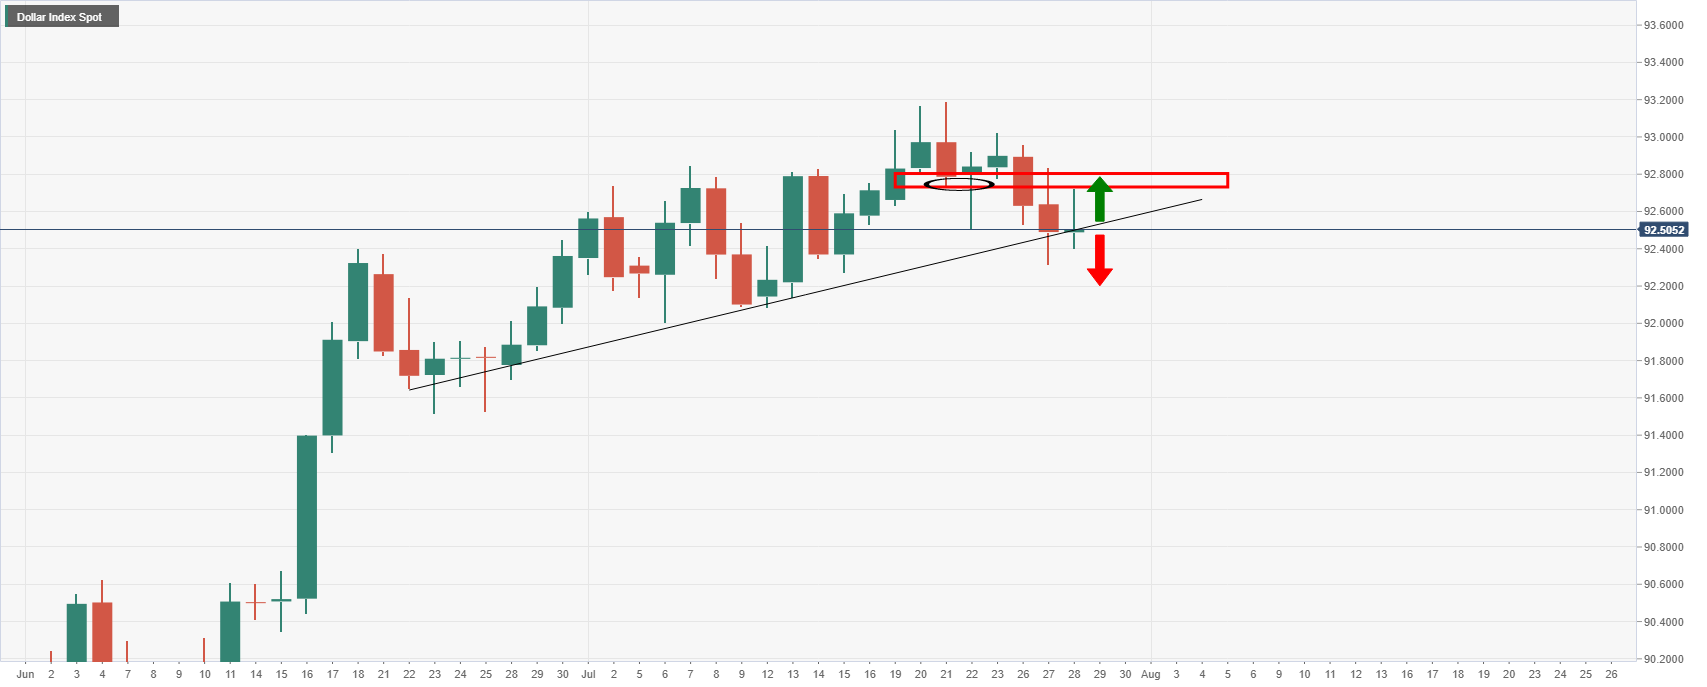
On the other hand, the dollar is ripe for a downside extension given that the resistance has already been tested and held.
A break of the trendline resistance would be a significant development in the greenback and likely point to lower lows for the near term.
DXY, 4-hour chart