- DXY picks up bids to consolidate Monday’s losses, justifies bullish candlestick formation, MACD signals.
- 100-SMA adds to the downside filters before two-week-old horizontal support.
- Bulls eye October’s peak, monthly high can test short-term traders.
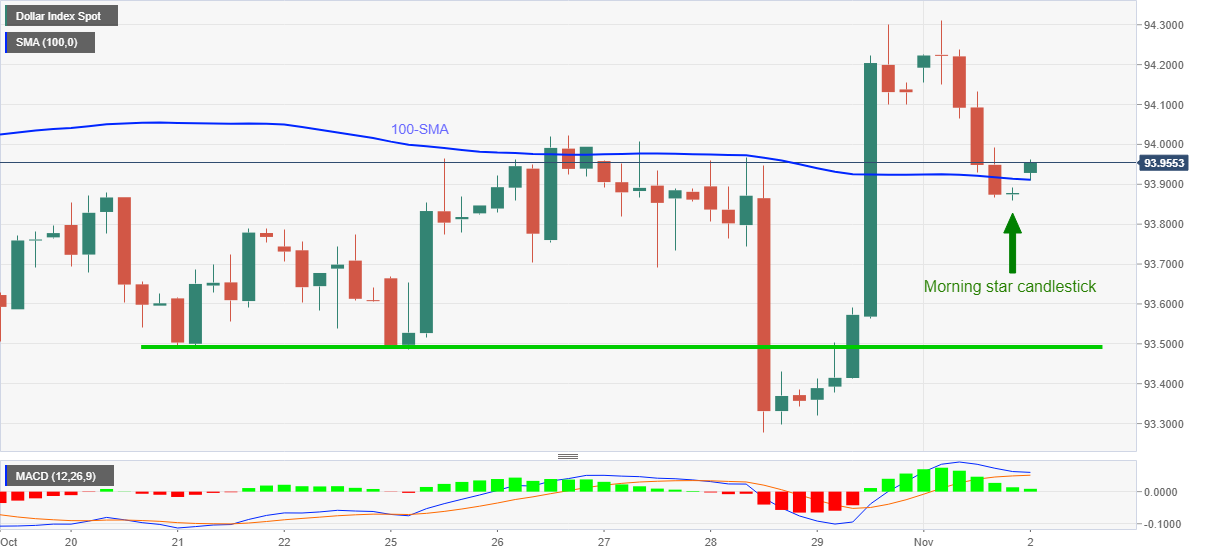
US Dollar Index (DXY) takes the bids to refresh intraday high around 94.00, up 0.09% on a day during early Tuesday. The greenback gauge reversed from a three-week top the previous day before portraying the latest bullish candlestick on the four-hour (4H) play.
In addition to the shooting star candle, bullish MACD and the pair’s ability to regain the 100-SMA status also keeps the buyers hopeful.
That said, the DXY bulls again aim for the monthly peak near 94.30 before targeting the yearly top surrounding 94.55, marked in October.
Should the US Dollar Index upside momentum remains intact past 94.55, March 2020 low near 94.70 will be in focus.
Meanwhile, DXY sellers need to refresh the weekly low, around 93.85 at the latest, to retake the controls and reject the bullish candlestick.
Following that, a horizontal area comprising multiple lows marked since late October near 93.50 will challenge the quote’s downside targeting the last month’s bottom close to 93.25.
DXY: Four-hour chart
Trend: Further upside expected