- Palladium gradually overcomes three-month low, up for second positive day.
- 50% Fibonacci retracement, 100-DMA guards immediate upside, multiple horizontal lines test the bulls afterward.
- Late March low, 61.8% Fibonacci retracement restrict short-term downside.
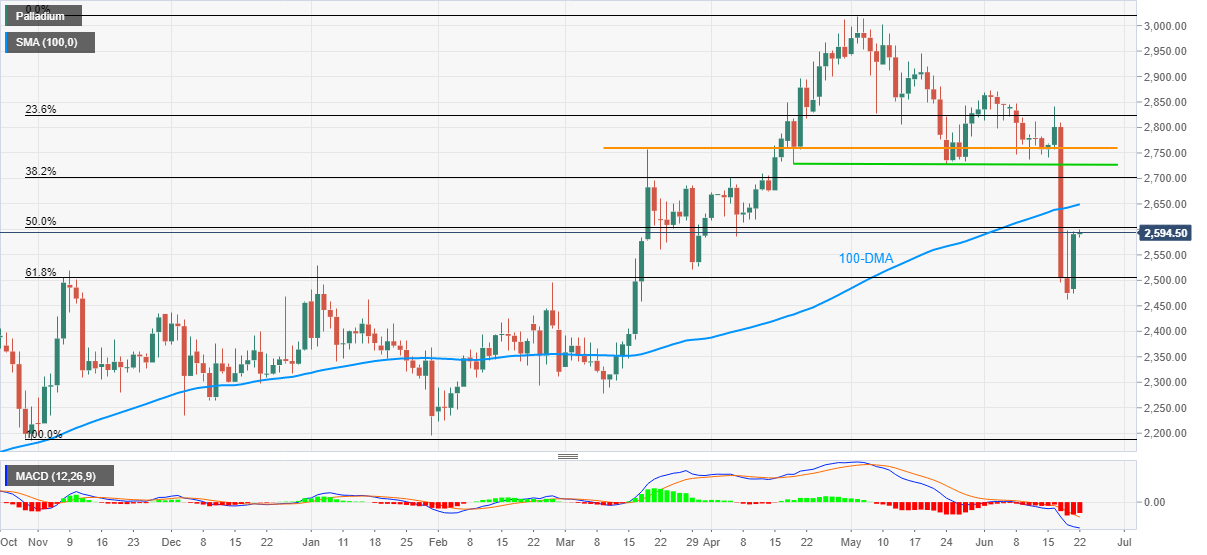
Palladium (XPD/USD) holds onto the previous day’s recovery moves from mid-March lows, taking rounds to $2,595 heading into Tuesday’s European session. In doing so, the precious metal gains 0.14% intraday as it battles the 50% Fibonacci retracement (Fibo.) of October 2020 to May 2021 upside.
Given the receding bearish bias of MACD and the commodity’s sustained trading above the key Fibonacci retracement, namely the 61.8% Fibo., Palladium buyers can cross the immediate hurdle surrounding $2,600. However, the quote’s further upside will be probed by 100-day SMA (DMA) level near $2,650.
During the XPD/USD upside past $2,650, 38.2% Fibonacci retracement around $2,705 holds the key to the run-up towards two horizontal lines, stretched from late April and March, respectively around $2,730 and $2,760.
Alternatively, $2,560 may entertain the intraday sellers ahead of directing them to 61.8% Fibo. retest, near $2,505.
If at all the commodity prices fails to stay beyond $2,500, the latest low near $2,460 adds to the downside filters.
Overall, palladium remains on the recovery mode but multiple hurdles test the bulls and can offer intermediate pullbacks.
Palladium daily chart
Trend: Further recovery expected

