- Gold price is comfortably shifted above 2,020.00 amid rising bets for a steady Fed monetary policy.
- A slowdown in the hiring process by US firms has scaled expectations of an unchanged Fed policy towards north.
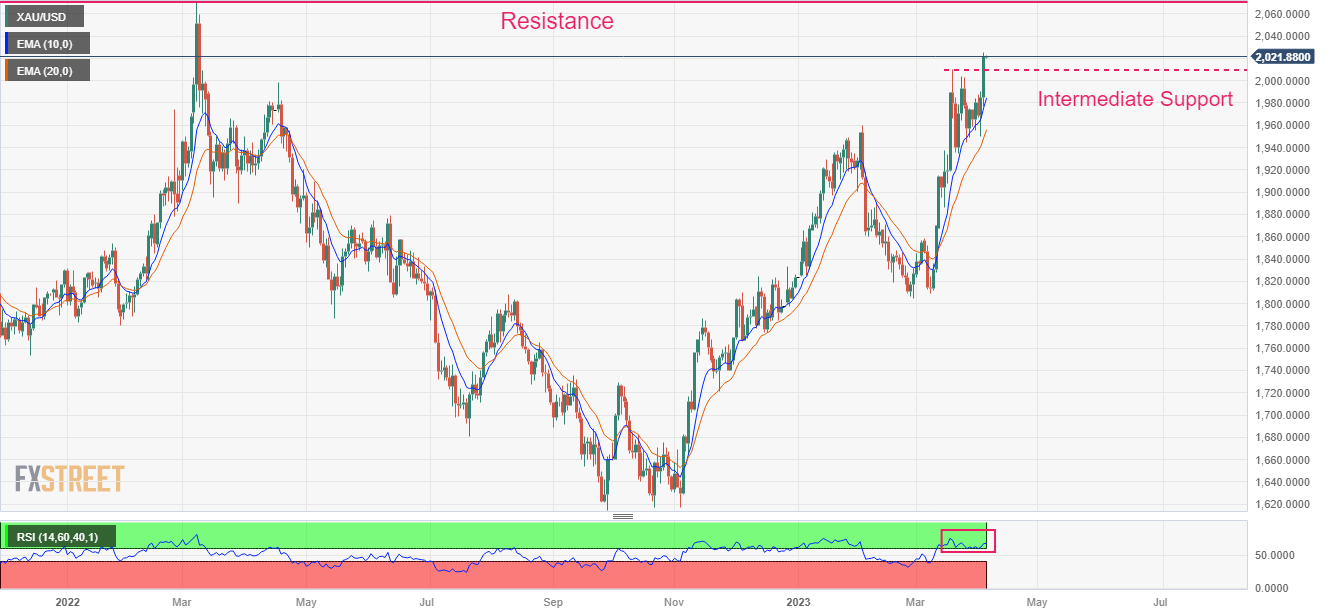
- Gold price is marching towards the horizontal resistance plotted from 08 March 2022 high at $2,070.54.
Gold price (XAU/USD) has shifted its auction profile comfortably above $2,020.00 in the early Asian session. The precious metal delivered a decisive break above the psychological resistance of $2,000.00 on Tuesday after the release of weak Job Openings data confirmed that the United States labor market is cooling-off and the Federal Reserve (Fed) would prefer to adopt a neutral stance on interest rates.
As per the CME Fedwatch tool, the chances of an unchanged policy have scaled near 59%.
The US Dollar Index (DXY) has refreshed its monthly low at 101.45 and more losses are in pipeline as policy divergence of the Fed with central banks would trim ahead. Meanwhile, S&P500 futures are adding gains in early Tokyo after a negative Tuesday, indicating a recovery in the risk-taking capacity of the market participants.
Investors will keep an eye on oil prices, as the only measure, which could impact the upside rally in the Gold price. Higher oil prices would stimulate global inflation as factory owners would pass on the impact of costly oil to end users. This could trigger some recovery in expectations for the continuation of a policy-tightening spell by the Fed.
Going forward, US Employment and ISM Services PMI data will remain in the spotlight. According to the consensus, the US economy has added fresh 200K jobs in March than the former additions of 242K.
Gold technical analysis
Gold price is marching towards the horizontal resistance plotted from the 08 March 2022 high at $2,070.54 on a daily scale. Intermediate support is placed from March 20 high at $2,009.88.
Upward-sloping 10-and 20-period Exponential Moving Averages (EMAs) at $1,984.00 and $1,956.12 respectively, indicate that the bullish momentum is extremely strong.
The Relative Strength Index (RSI) (14) is oscillating in the bullish range of 60.00-80.00, showing active upside momentum.
Gold daily chart