Update: Gold lacked any firm directional bias and seesawed between tepid gains/minor losses, around the $1,890 region through the mid-European session. Investors now seemed reluctant to place any aggressive directional bets, rather preferred to wait for a fresh catalyst from Thursday’s release of the US consumer inflation figures. This will be another piece of important macro data that would set the tone for the FOMC meeting on June 15-16 and play a key role in determining the next leg of a directional move for the non-yielding yellow metal.
Investors remain concerned that rising inflationary pressure might force the Fed to taper its bond-purchase program sooner rather than later. That said, a combination of factors acted as a tailwind for gold and helped limit the downside. The yield on the benchmark 10-year US government bond prolonged its recent downward trajectory and slipped below the key 1.50% threshold for the first time since May 7. This, in turn, kept the US dollar bulls on the defensive and extended some support to dollar-denominated commodities, including gold.
Despite the supporting factor, gold, so far, has struggled to find acceptance above the $1,900 round-figure mark and has been oscillating in a narrow band since the beginning of this week. In the absence of any market-moving economic releases from the US, it will be prudent to wait for a sustained break through the weekly trading range before positioning for any meaningful trading opportunities.
Previous update: Gold price is back in the red, having reversed early bounce while keeping Tuesday’s trading range so far this Wednesday. As markets remain in a ‘sell everything mode’ ahead of the much-awaited US CPI data, gold price is also riding the offer wave, unable to take advantage of the ongoing US-China tussle and renewed weakness in the US dollar and the Treasury yields.
Investors resort to repositioning, as the US inflation data and the European Central Bank (ECB) policy meeting due tomorrow could stir markets. The US CPI report is expected to shed light on when the Fed will begin rolling back its monetary stimulus. Also, the Bank of England (BOE) policymaker Andy Haldane’s taper talk amid roaring economy added to the weight on the non-yielding gold.
Read: Gold Price Forecast: XAU/USD to extend range play near $1900, with focus on US inflation
Gold Price: Key levels to watch
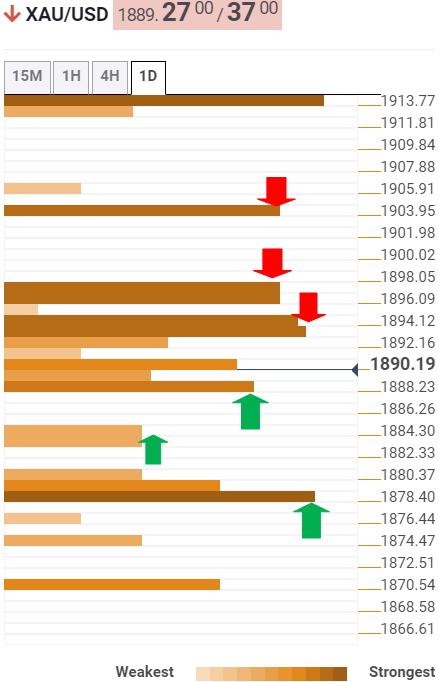
The Technical Confluences Detector shows that gold price remains on track to incur deeper losses amid a bunch of strong resistance levels.
The immediate support is seen at the SMA100 one-hour at $1888, below which the sellers will target the previous day low of $1884.
The intersection of the Fibonacci 23.6% one-month and Fibonacci 38.2% one-week around $1879 is likely to protect the further downside.
Alternatively, gold bulls will have to scale two powerful upside barriers, in order to negate the bearish bias in the near term.
The first hurdle awaits at $1894, which is the confluence of the SMA5 one-day, Fibonacci 61.8% one-week and SMA5 four-hour.
A firm break above the latter will expose the $1897 supply zone, where the Fibonacci 61.8% one-day and SMA10 one-day converge.
The next significant barrier is placed at $1903, the meeting point of the previous day high and pivot point one-day R1.
Here is how it looks on the tool

About Technical Confluences Detector
The TCD (Technical Confluences Detector) is a tool to locate and point out those price levels where there is a congestion of indicators, moving averages, Fibonacci levels, Pivot Points, etc. If you are a short-term trader, you will find entry points for counter-trend strategies and hunt a few points at a time. If you are a medium-to-long-term trader, this tool will allow you to know in advance the price levels where a medium-to-long-term trend may stop and rest, where to unwind positions, or where to increase your position size.
