- The GBP/USD is gaining up some 0.18% in the week amidst a thin liquidity trading session.
- A buoyant US dollar and risk-aversion weighed on the British pound in the week.
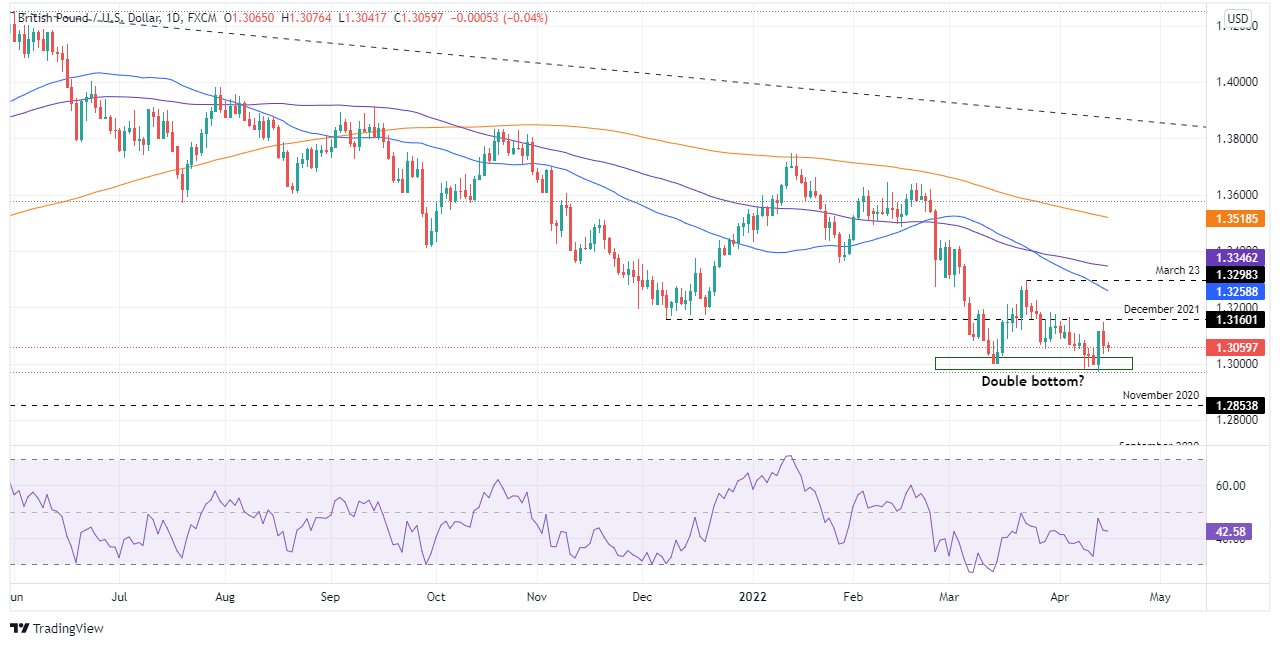
- GBP/USD Price Forecast: To remain downward biased but a double bottom looms.
The British pound remains defensive, trading below the 1.3100 mark, on the back of a buoyant US dollar amidst a dull trading session as financial markets are closed In the observance of Easter Friday. The GBP/USD is trading at 1.3061 at the time of writing.
The GBP/USD has remained under pressure in the week. A stronger US dollar and diminished risk appetite spooked GBP bulls, as the GBP/USD is about to end the week with modest gains of 0.18%. Contrarily, the US Dollar Index, a gauge of the greenback’s value against a basket of its rivals, edges up 0.68%, sitting at 100.519, underpinned by high US Treasury yields throughout the week.
During the week, the UK’s mixed economic data kept the GBP/USD trading around 1.3000-1.3160. UK inflation rose above the 7% threshold, higher than the 6.7% estimated, opening the door for a subsequent 25 bps rate hike by the Bank of England. Meanwhile, the Gross Domestic Product (GDP) for February disappointed, increased by 0.1% m/m, lower than the 0.3% estimations, giving a signal that the UK’s economy is slowing. Regarding labor figures, data came mixed, with Employment Change for January disappointing, with just 10K new jobs vs. 50K foreseen, while the Unemployment Rate for February came at 3.8%, aligned with estimations.
In the meantime, the US economic docket revealed that consumer inflation in March rose above the 8% threshold, at 8.5% y/y, the highest since 1981, while excluding volatile items, the so-called core, increased 6.5%, lower than the 6.7%, a signal that inflation was about to peak. Nonetheless, on Thursday, the Producer Price Index (PPI) sent the previous day’s expectations over the board, showing that prices paid by producers rose by 11.2% vs. 10.6% estimations. In comparison, core PPI increased by 9.2%, higher than 8.4%.
In the week ahead, the economic calendar will feature tier 2 data. In the UK, March’s Retail Sales are expected to show a contraction of 0.3%. On the US front, the docket will unveil the Fed Beige Book and S&P Global Manufacturing and Services PMIs.
GBP/USD Price Forecast: Technical outlook
The GBP/USD depicts a double bottom formation around the 1.3000 area, but the daily moving averages (DMAs) located above the spot price suggest the pair is downward biased. In line with the aforementioned is the Relative Strength Index (RSI) at 42.60, though it is worth noting the horizontal slope of the oscillator, which means the pair might consolidate around the 1.3050s area before resuming downwards.
The GBP/USD first support would be 1.3000. Once cleared, the next support would be 1.2900, followed by November 2020 cycle low at 1.2853.
However, to confirm the double bottom scenario, the GBP/USD needs to lift towards March 23 swing high at 1.3299. Once accomplished, the GBP/USD first resistance would be the 100-day moving average (DMA) at 1.3358, followed by 1.3400, and then the 200-DMA at 1.3518.