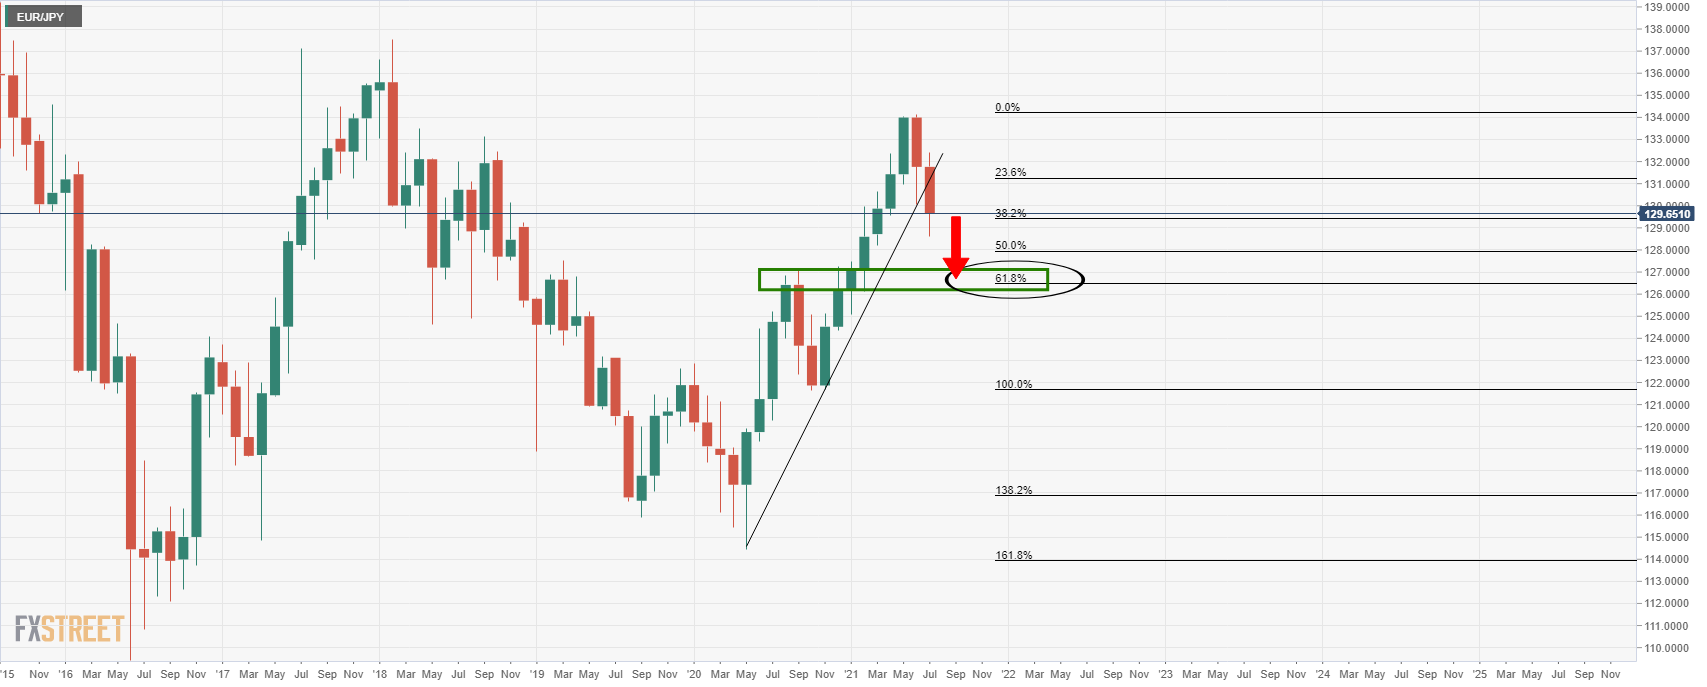
- EUR/JPY bears are eyeing a significant downside correction on the monthly time frame.
- The price is testing a critical daily and 4-hour resistance area.
The following is a bearish perspective of the current market structure in EUR/JPY across the time frames, from the monthly chart all the way down to the 4-hour chart.
Monthly chart
The price has broken below monthly dynamic support that would now be expected to act as a counter trendline while price moves back to test the old resistance in a 61.8% Fibonacci retracement near 127.00.
Weekly chart
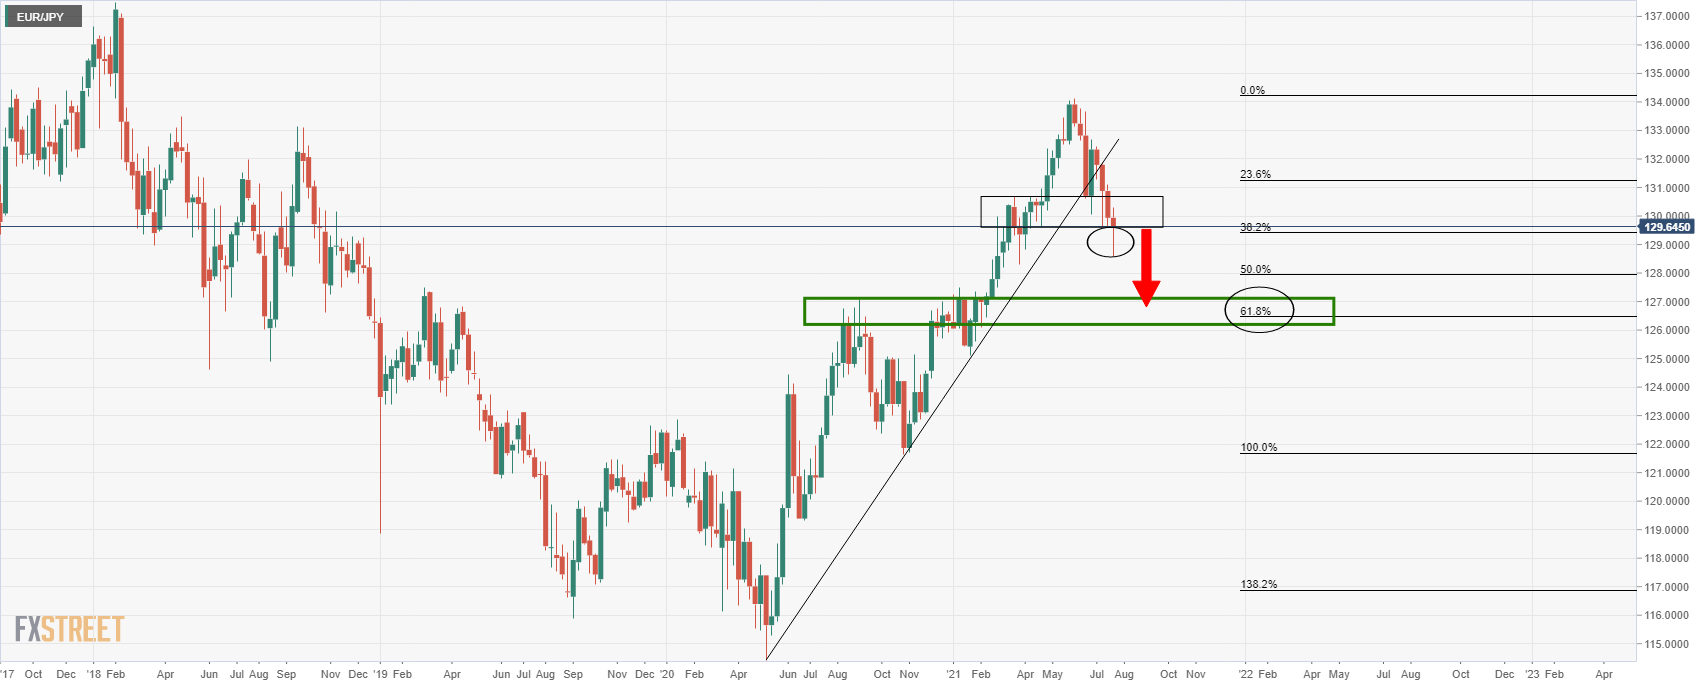
The weekly chart shows that the price is leaving a bearish wick and should the week close with a lower weekly closing low, then the wick would be expected to be filled on the lower time frames in due course.
Daily chart
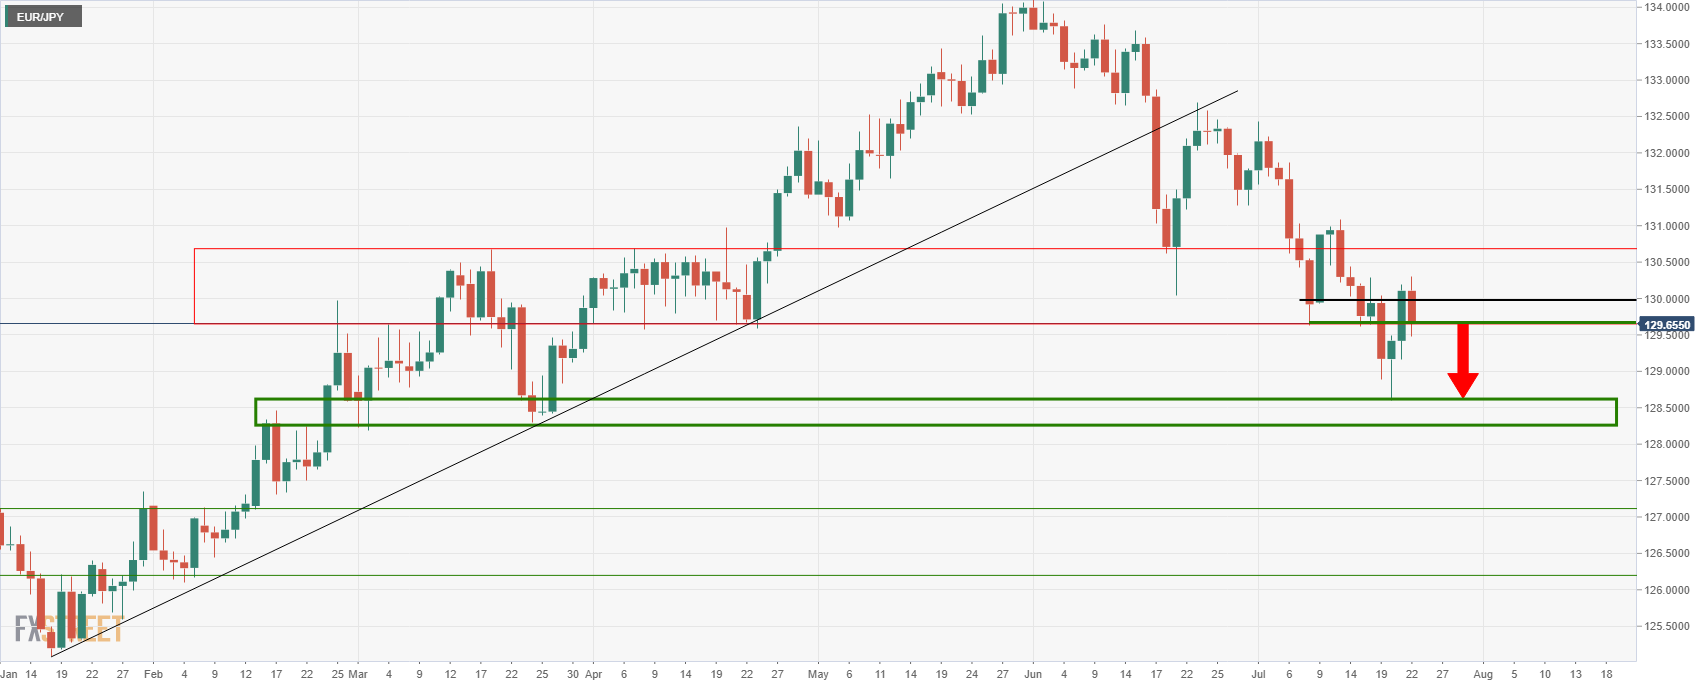
Meanwhile, from a daily perspective, the price has corrected into resistance which is so far holding up.
Expectations are for a downside continuation at this juncture.
4-hour chart
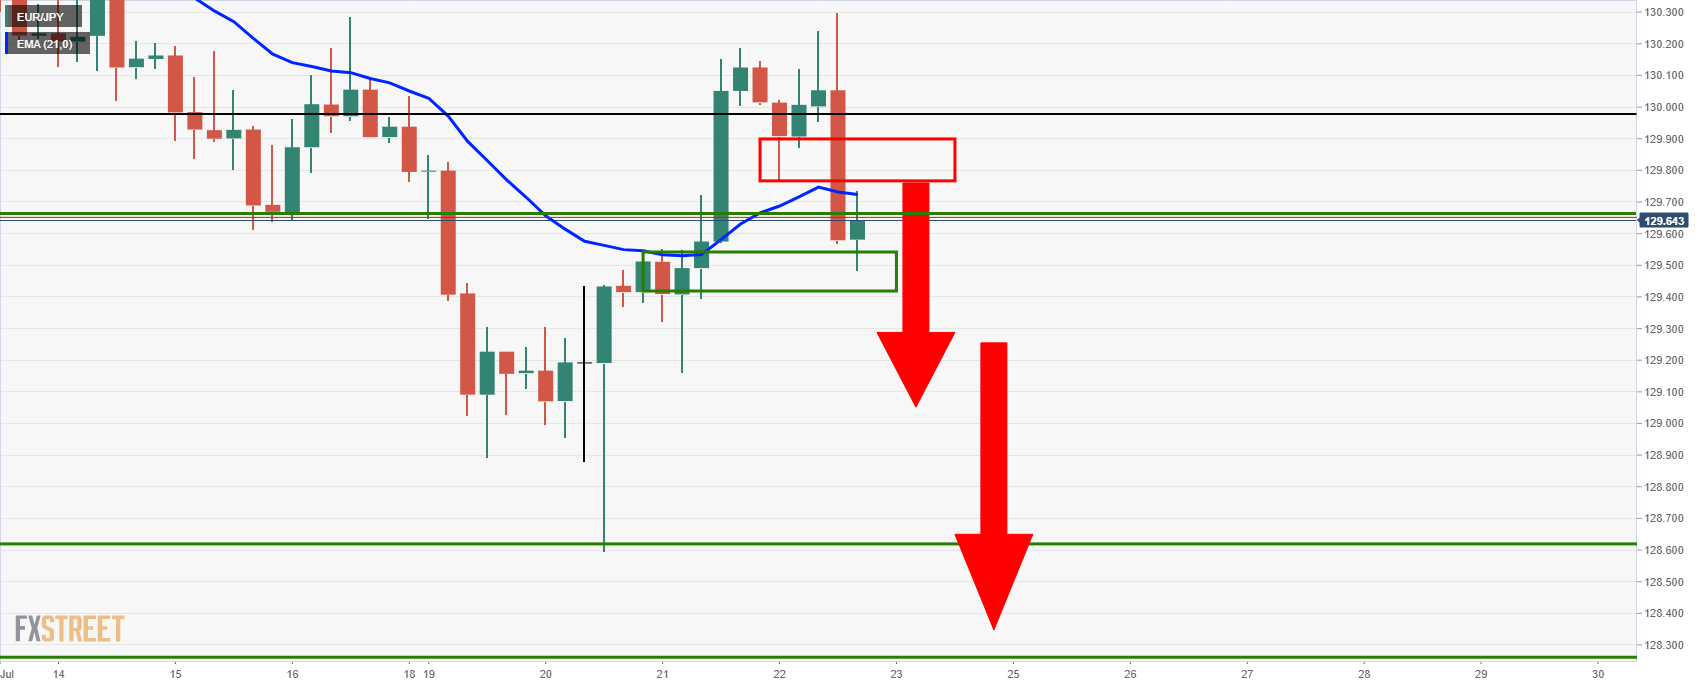
From the 4-hour chart, we can see that the price is moving in on the 21-EMA and prior lows which are the neckline of the M-formation.
This are would be expected to act as resistance, resulting in a move to the downside and towards the monthly target area over time.


