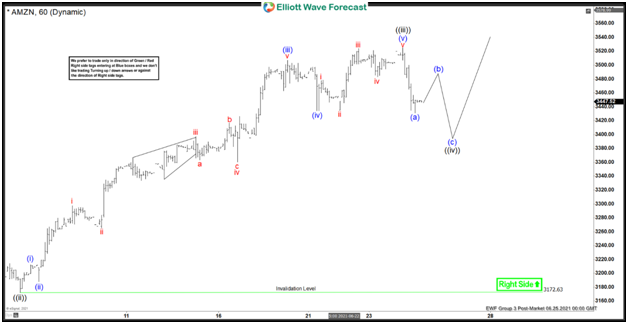
Short term Elliott Wave View in Amazon (AMZN) suggests the rally from May 11, 2021 low is unfolding as a 5 waves impulse Elliott Wave structure. Up from May 11 low, wave ((1)) ended at 3312 and pullback in wave ((ii)) ended at 3172.2. The stock then resumed higher in wave ((iii)) which ended at 3524.86. The internal of wave ((iii)) unfolded as another impulse in lesser degree as the 1 hour chart below shows.
Up from wave ((ii)), wave (i) ended at 3212.36 and pullback in wave (ii) ended at 3187.89. The stock resumed higher in wave (iii) towards 3507, wave (iv) pullback ended at 3434, and final leg wave (v) higher ended at 3524.86. This completed wave ((iii)) in higher degree. Wave ((iv)) pullback is now in progress to correct cycle from June 8 low before the rally resumes. Internal of wave ((iv)) is in progress as a zigzag structure where wave (a) ended at 3430.85. Expect the stock to bounce in wave (b), then turns lower 1 more time to end wave (c) of ((iv)) before the rally resumes. Potential target for wave ((iv)) is 23.6 – 38.2% Fibonacci retracement of wave ((iii)) which comes at 3389.4 – 3440.7. Near term, as far as June 8 pivot low at 3172.6 remains intact, expect dips to find support in 3, 7, or 11 swing for further upside.

