Apple and Amazon will release earnings after the bell today.
So what is expected?:
Estimates for Apple’s earnings:
- Revenue: $81.7 billion
- Earnings per share (EPS): $1.19
- iPhone revenue: $39.9 billion
- iPad revenue: $6.4 billion (down 11% on the year)
- Mac revenue: $6.6 billion
- Other products: $8.4 billion
- Services: $20.8 billion
The revenues are expected to fall for the 3rd consecutive year with decreases in iPhone, iPad, wearables, and Mac sales. However the service division is expected to rise over 5%.
Estimates for Amazon earnings:
- Earnings per share (EPS): 35 cents
- Revenue: $131.5 billion (up 8.5%)
- Amazon Web Services (AWS) revenue: $21.8 billion
- Advertising revenue: $10.4 billion
The revenues have been in single digits for 5 of 6 quarters.
AWS is a significant growth driver but its pace is slowing. Q1 AWS sales increased around 16% last quarter which was the lowest increase since 2015. Analysts are expecting a further slowdown to 10% in the current quarter. Having said that AI workloads, cloud profit margins, and easing comparisons are expected to contribute to AWS revenue growth from Q3 onward.
Cost-cutting will be of interest with expectations of improved retail margins. The company is also reported improvements in delivery speeds and efficiencies in its fulfillment network.
What are the technicals saying:
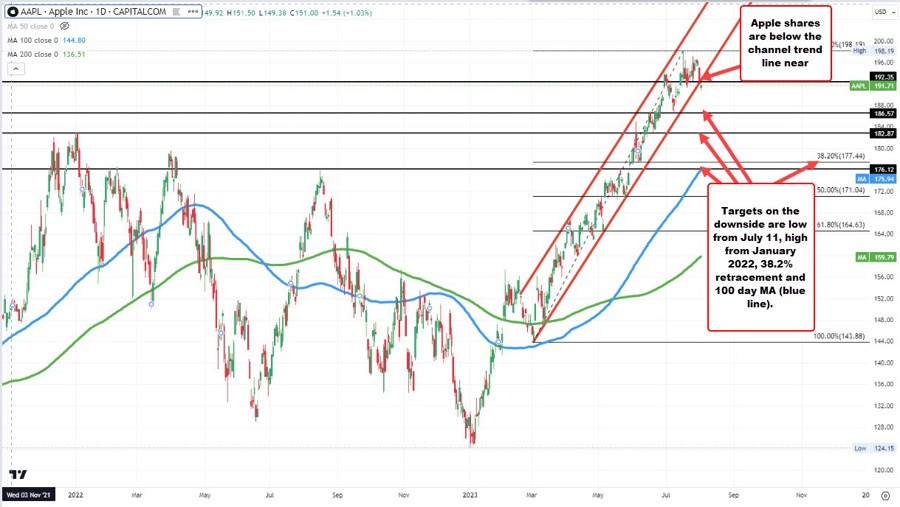
Looking at the daily chart of Apple (see daily chart below), the price today has broken below a lower channel trendline near $192.40. Getting back above that trendline is needed to increase the bullish bias. The current price is trading at $191.85
The high for the year – and also all-time high price – came in back on July 19 at $198.19. Last week’s high reached $197.17. Those 2 levels are targets on a move back above the lower channel trend line. Needless to say getting above the all-time high opens the door for more upside potential
Targets on the downside now include:
- The swing low from July 11 at $186.57.
- The old all-time high price going back to January 2022 at $182.87.
- The 38.2% retracement of the move up from March 2, 2023, comes in at $177.44
- The 100-day moving average is at $175.94
Apple falls below the channel trend line
Looking at Amazon (see chart below), the high price this year reached up toward the 50% of the move down from the all-time high. That midpoint level comes in at $134.74. The high price for the year comes in at $136.58. Those 2 levels are key targets on a move to the upside. The current price is at $129.06.
On the downside, the upward-sloping lower trendline comes in at $125.50. Below that, the broken 38.2% retracement of the move down from the all-time high comes in at $122.14. Finally, below that and traders will start to look toward the rising 100-day moving average at $115.57.
Amazon technical levels in play through earnings