Th major US stock indices are rotating lower. The S&P index is traded to a new session low. The NASDAQ is also now breaking below the low from the 1st hour of trading today.
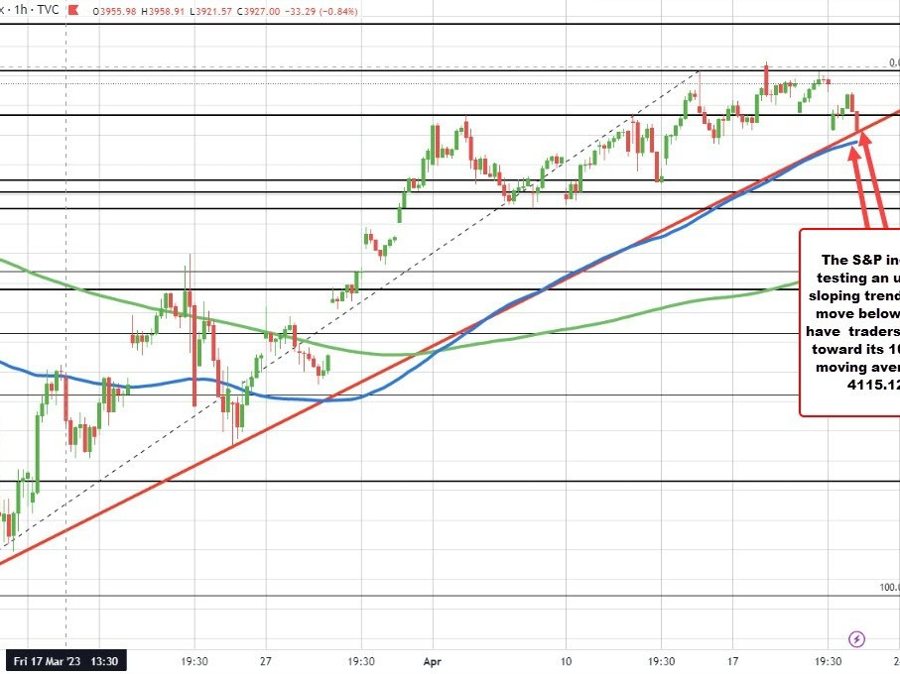
Looking at the hourly chart of the S&P index the price is testing a upward sloping trend line. A move below that trend line and traders would look toward the 100 hour moving average at 4115.14.
S&P indexes testing and upward sloping trendline
For the NASDAQ index, is currently trading down -114.64 points are -0.94% at 12043.47. Looking at its hourly chart, the price has moved back below its rising 100 hour moving average 12087.90. At the open, the price traded below that moving average. The last few times below the 100 hour moving average has seen the break fail. Will the price stay below this time? Sellers are taking back some short term control.
NASDAQ index
The Dow is also sharply lower with the price down over -214 points or -0.63% at 33682.