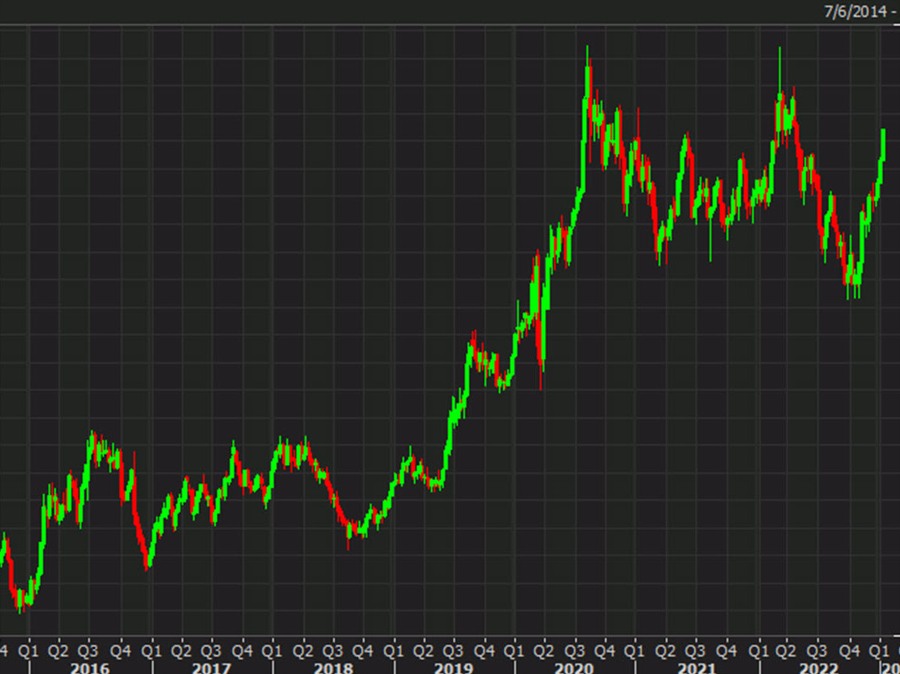
gold daily chart
The gold bulls are certainly having a moment.
At the start of December, as I always do, I highlighted the seasonal trend towards higher gold. Once again, it worked and remains the single-best seasonal trade I know of. It’s been a ticket to start the year off with a solid gain forever.
This year has been particularly good with gold surging off a triple bottom in early November. The gains accelerated after softer October CPI and has been supercharged by the retracement in the US dollar and expectations for a less-hawkish Fed.
It’s now up 17% since the start of November, 10% since the start of December and 5.2% since the start of the year.
Perhaps most important for the view going forward is the lack of any real resistance ahead of $2000. Gold this week cut through some minor resistance at $1877 while barely slowing down.
Last week, I highlighted the inverted head-and-shoulders pattern targeting $1975 and that remains a compelling target.
If the gold rally is more than the usual seasonal trade — and I’m open-minded — the catalyst will be continued buying from global central banks looking for alternatives to USD reserves. At the start of the month, we learned that China has increased its gold buying and Russia is likely adding to reserves as well.
Zooming all the way out the chart looks like a false breakout to the downside and a quick reversal. If so, that could break the double top and and send gold to $2500.
gold weekly chart
