Test of 100 hour MA at the high, finds sellers.
The USDCHF on the hourly chart below, shows an up and down kind of day. That is the reverse of yesterday’s day which saw the price first move lower, before snapback higher.
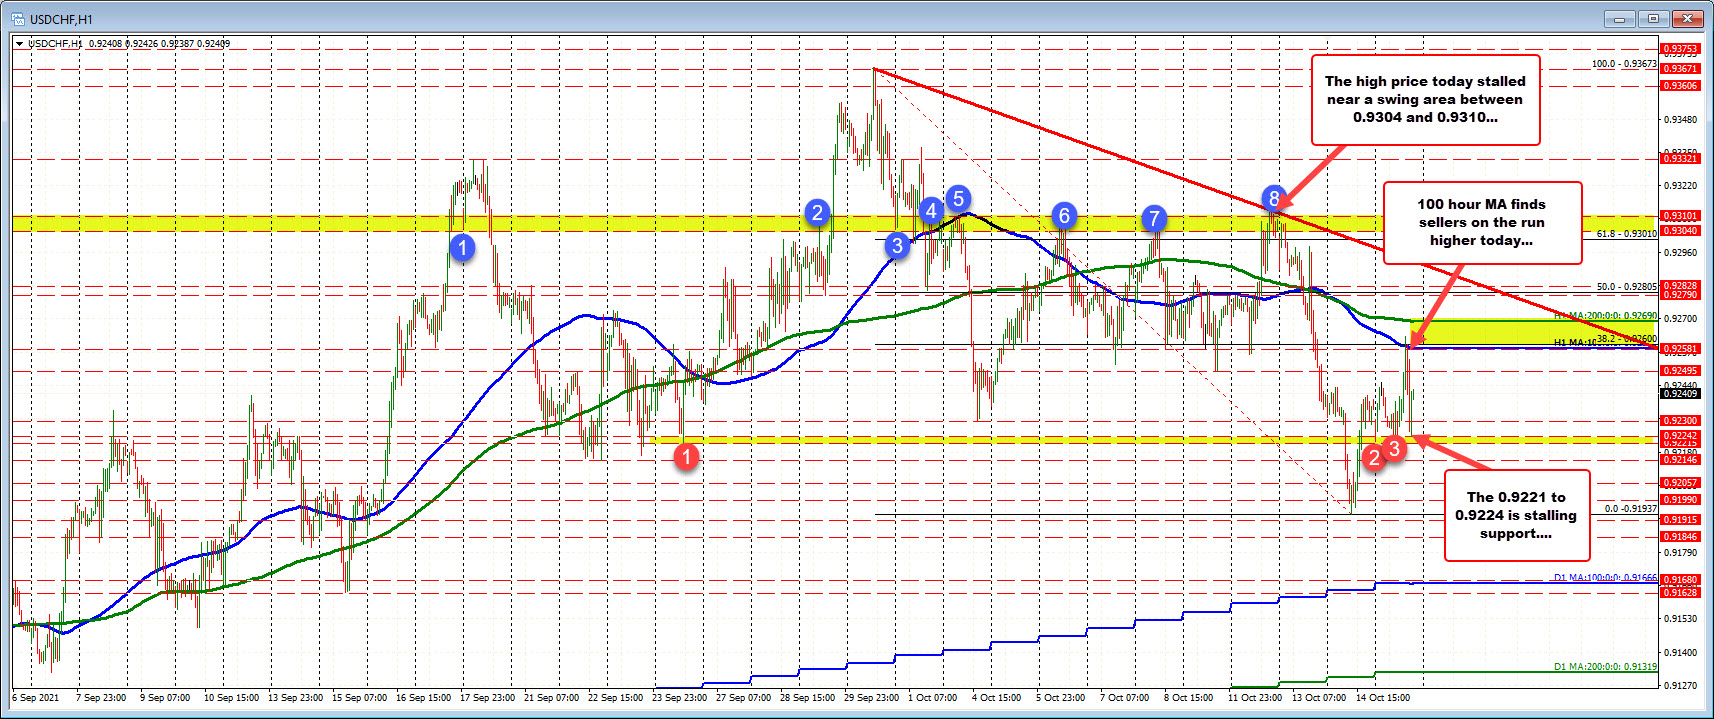
The run higher today reached up toward the 100 hour moving average and the 38.2% retracement of the move down from the September 30 high. Those levels came near 0.9260. The high price for the day reached 0.92633.
The subsequent move to the downside raced down to test the low price from the late Asian/early European session near 0.9224. The 0.9221 to 0.9224 is interim support swing area ahead of the low for the week at 0.91937 (from yesterday’s trade). Admittedly that floor was more or less created today (with three separate lows including the current run to the downside). There also was a swing low going back to September 24 within that area.
The current price trades at 0.9242 between those two levels.
For the week the high was reached on Tuesday. The price stalled near a swing area between 0.9304 and 0.9310 (the high price reached 0.93125 just above that swing area)
The low for the week stalled at 0.91937. That low was somewhat random before snapping back to the upside and retracing the move lower during yesterday’s trade.