Technical levels for the major indices
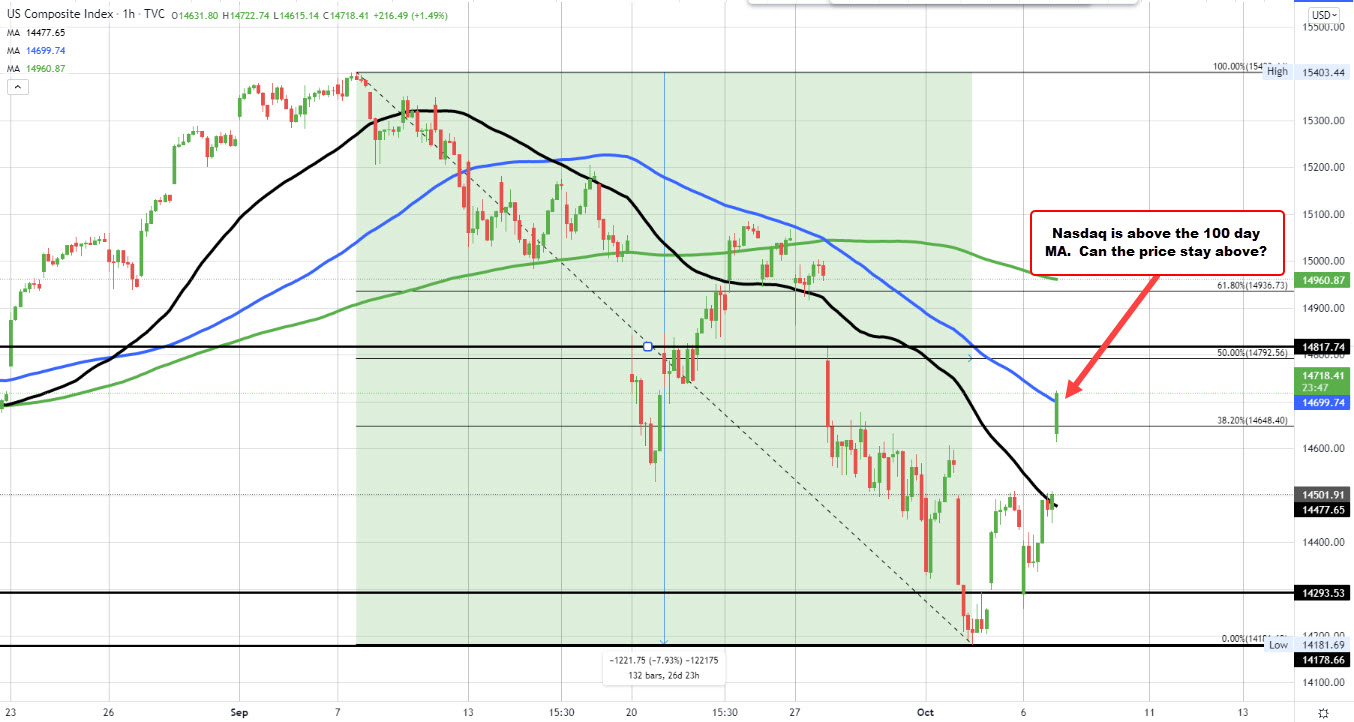
The NASDAQ index is up 1.55% at 14728.30. In the process the price has moved back above its 100 day moving average at 14699.74 (blue line in the chart below. Stay above would have traders targeting the 50% midpoint of the move down from the September high which comes in at 14792.56.
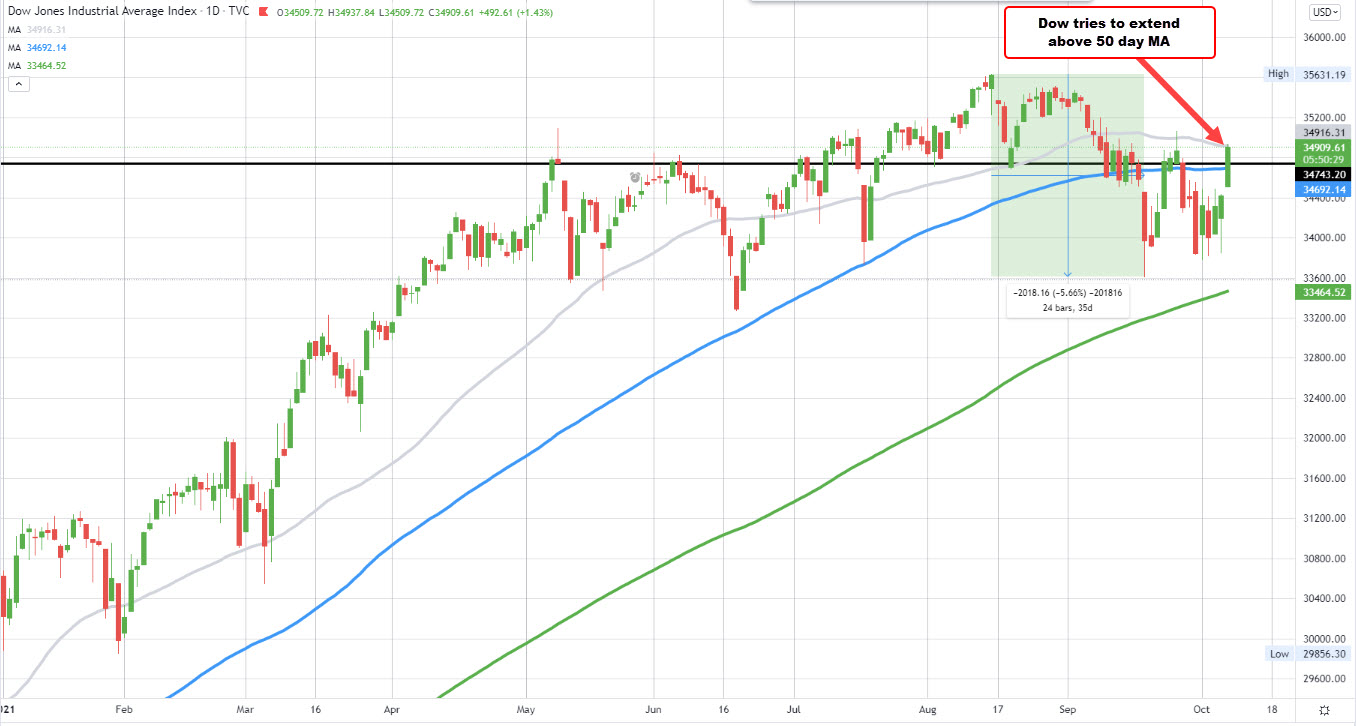
Looking at the Dow industrial average, it is testing its 50 day moving average at 34916.31. As I type the prices above that level at 34937.75, up 519 points or 1.51%. Stay above is more bullish for that index.

Finally for the S&P index, it gapped above its 100 day moving average at 4379.82 and the 38.2% retracement of the move down from the September high at 4380.90. The price has since moved above the 50% midpoint of the move down from the September high at 4412.40. That will be eyed as close risk is now. The price is currently trading at 4426.70, up 63.58 points or 1.46%. The next key target comes in against its 200 day moving average of 4440.77.
This article was originally published by Forexlive.com. Read the original article here.
